

Options are surgical tools. If your thesis is simply “I want to be long,” just buy the stock. An option turns your directional view into a parlay with time.
That said, if you do choose options, this post is about how to size the trade.
You’ll learn:
- Two sizing approaches and their tradeoffs
- How to choose between them
- Where the option frameworks plug into your general portfolio construction
The continuum of conviction
Views live on a continuum from vibey to discrete.
“AI capex is real and this name will grow even faster than its fat multiple is pricing” is vibey.
“110 by next June” is discrete.
The vibier the view, the more the option is a substitute for a vanilla long stock position. In these cases, we size the options position as a substitute for an equivalent stock position. We will call this delta-based sizing.
A highly specific view is more like a bet. This is where options really shine as surgical tools. They allow you to construct a bet with tremendous leverage if you are right. Just think of how buying a butterfly spread with strikes $5 apart for $.50 pays you 9-1 on the stock expiring exactly on the center strike.
Of course, the more specific the view, the higher the odds but the lower the hit ratio. You’re 50/50 on whether a stock will go up or down, but the probability of being right on “110 by next June” is a subset of the 50% probability. The partial probability is whittled down by the need to get direction right, timing right, and nailing only part of the upside distribution of prices.
If the view is specific and variant, the more the options look mispriced to you. Option surfaces start with some implied distribution based on past behavior, but react to order flow. The prices you face are some mix of model and consensus. That’s why a variant view makes them look so mispriced. It’s hard to be right with variant views, but the rewards are also outsize. These features mean we should use risk-budget sizing.
Set-up
To appreciate the differences in approach, we set up a toy example to keep the scenario constant.
Assuptions (more detail in Appendix):
- $100 stock
- 35% ATM IV ; modest equity style skew for OTM option
- One year to expiry
Your view:
The view is the stock trades up to 110 or better sometime this year.
Your budget:
$10,000 in capital devoted to expressing a view in this name
The 1-year 110 call has a .46 delta and costs $10.12
Risk-budgeted sizing
All $10,000 goes into premium: 9.9 contracts.
[Just for option practice, we say “that’s 990 shares of notional” and using .46 delta, it’s 456 share-equivalents of initial exposure.]
Delta-equivalent sizing
Start from the “null” decision. $10,000 would buy 100 shares, so the delta-equivalent option position should carry 100 deltas: 100 ÷ 46 ≈ 2.2 contracts costing $2,194, with $7,806 sitting in cash.
Observe:
The risk-budget position is nearly 5x larger. Note that a year of time value on a near-the-money strike is expensive, which keeps the gap modest. If we shorten the clock or push the strike further out-of-the-money, these differences can span 10, 20, 30×.
This is how the position marks through the year. Rows are the stock price, columns are how much of the year has elapsed (vol is held flat):
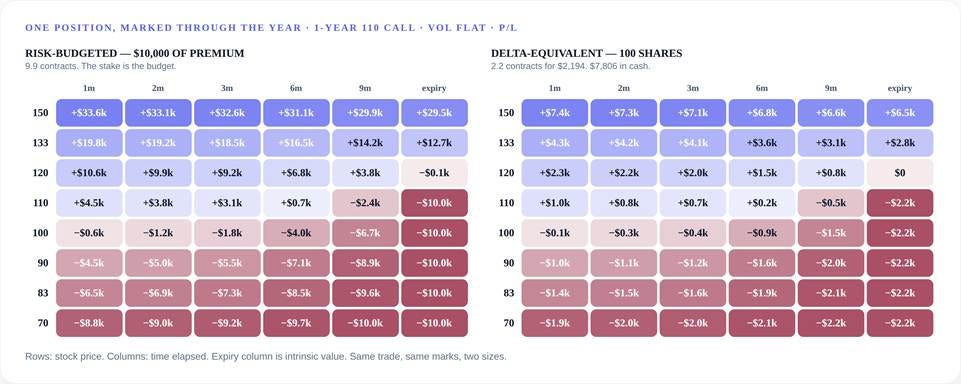
P/L of the 1-year 110 call through time. Expiry column is intrinsic value only.
Examine the risk-budget sizing
Read the 110 row of the left grid, from left to right:
- Reach the target in month one and you’re up $4.5k.
- Reach it in month six, up $700.
- Land exactly on the target on the last day and you’ve lost all $10,000.
Same price, but many outcomes depending on “when”.
This is what I mean when I say levered to specificity. The risk budget rewards precision. “Right on direction but still lost” is the maroon cells in rows 110 and 120.
Examine the delta-based sizing
The right grid runs the identical trade through the identical marks but stays in a much tighter band of roughly −$2.2k to +$7k. It is a more conservative expression of bullishness as it’s more of a broader investment idea than a specific bet.
At 110 in month one the call is up $1.0k, exactly what 100 shares make. In a fast move, it does better than the shares it replaced (at 150 in month one: +$7.4k against +$5.0k, that’s the gamma).
From there, if the stock dawdles all year at 110, the call bleeds from +$1.0k to −$2.2k while a vanilla share position would have maintained the gain.
what delta replacement actually is
The risk-budgeted approach is easy to understand because it’s a well-defined bet. The kind you’d make in a bar. I’ve had situations come up in trading where I thought an option got very cheap because I had a stronger sense of the terminal distribution of the underlying but not the path. A risk-budgeted trade made sense.
In the mid-2010s, I remember one in particular where I bought $1mm worth of summer calls in nat gas for a penny (10 ticks for the initiated reader). It started with me thinking the calls were very cheap from a vol perspective but I wanted to cross-reference that with price intuition. Looking at seasonal price distributions for summer gas I reasoned that I was likely getting about 7-1 on an option that would hit about 1 out of 4 times. So I bought the calls and stashed them in a sub-account where their greeks wouldn’t mix with my portfolio greeks that I regularly delta-hedged. I just accepted that I would lose $1mm if I was wrong.
Postscript: They never ended up going in-the-money but the interesting thing is they continued to trade for 10 ticks or slightly higher for the next month as my buy ended up being the nut low in the strike vol. If I did delta-hedge them, it would have been free gamma, as I would have gotten to scalp futures while the option didn’t decay (the vol increases would offset theta).
In the end, my scripted approach would have cost $1mm. If I would have kept them in the main book, it’s unclear if I would have gotten enough scalps to cover the full premium since they were low delta, but I also could have kicked them out a month later for the same price and held on to the scalp profits in the meantime. I actually don’t remember how I dealt with it as it wasn’t a major portion of my risk and it certainly didn’t pay off. The whole experience just faded into the soup of trading tens of thousands of options a day.
While risk-budget approach is intuitive, it’s worth peeling apart the delta-equivalent approach.
A clean way to appreciate the delta-sized position is to subtract the stock it replaced to view the excess return relative to the null stock position.
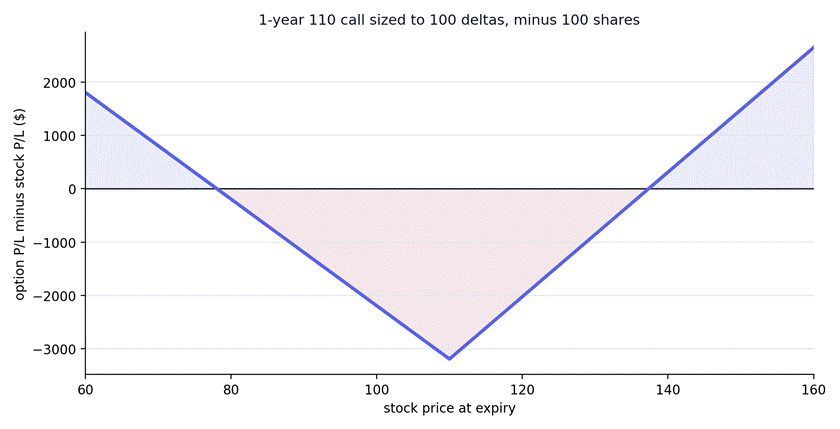
2.2 contracts of the 1-year 110 call minus 100 shares, at expiry. Crossovers near 79 and 138.
The option expression is better off than being a pure share expression if the stock falls or rises by huge amounts, it’s worse in the belly, and maximum regret sits right at the long strike. This is why being long options is being “long volatility.” You are better off in both large upside and downside moves. Every call has a put inside it (put-call parity is the algebraic proof of what you see in the chart).
delta, three ways
The intent to be long 100 shares can be generalized to be “I want +100 deltas of this name.”
We already compared the stock expression with the delta-equivalent. A third which I’ve been discussing a lot recently since their pricing has been notable is a collared stock position — now with normal single-name skew (puts bid over calls relative to the 35 ATM):
Own the stock, buy the 1-year .25-delta put, sell the 1-year .25-delta call
Using our toy set-up:
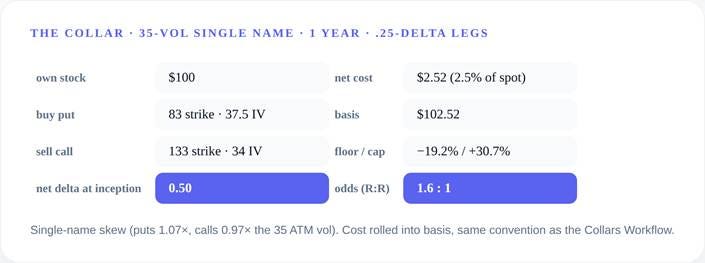
The collar spec. Cost rolls into basis, same convention as the Collars Workflow.
The strikes land at 83 and 133, the package costs about 2.5% of spot, and rolling that into basis you’re risking 19.2% to make 30.7%. Call it 1.6-to-1 odds.
Put-call parity applied to spreads
Here’s another way to see the collar.
By put-call parity, stock + put − call is exactly a long 83/133 call spread plus $83 of cash per share.
Why?
The cash is the put strike. Shares plus an 83 put can never be worth less than $83 at expiry. The guaranteed floor is money in the bank. The package is $83 sitting in a riskless account plus a call on everything above 83. (With rates, discount it. The toy is zero carry, so it’s the strike exactly.)
Pricing it out:
The 83 call costs $23.53, short the 133 call at $4.32, spread costs $19.21
Park $83.30 (the actual .25d put would be the 83.30 strike), yields $102.51, which is the collar’s basis to the penny.
A collared stock position is a deep in-the-money call spread.
Take note of the net delta at inception: 0.50.
A collared share is equivalent to half a share, so to initiate an intent of 100 deltas, we must collar 200 shares.
[You may say, but Kris where does the capital for more shares come from? You can borrow it. We assumed no financing costs. But even if that irks you, look at the grey box again. You can buy the 83/133 call spread on 200 shares (2 contracts) without borrowing. Option pricing is such that you should roughly be indifferent between the carrying costs of both expressions since they are accounted for in the “no-arbitrage” models used to price contracts. Insofar as your funding costs vary from market-makers, there can be win-win decisions whereby one option structure is more attractive than the other based on your own funding rates.]
Here’s three expressions of the same 100 deltas, side by side:
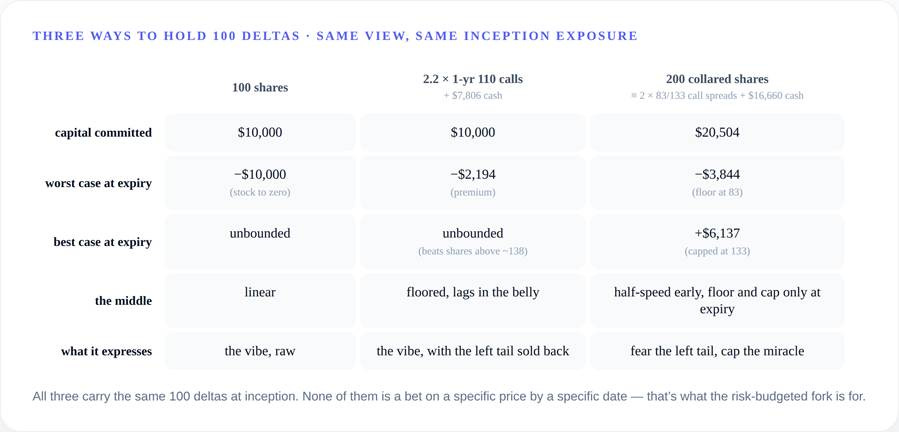
The grid highlights the tl;dr:
You are levered to the stock going up modestly, financed by the risk of it going down modestly. In the extremes, your collared p/l will “lock” to a value close to the extreme cells as your position “disappears” (your long stock will either be called away or your puts will protect you if the shares go to zero).
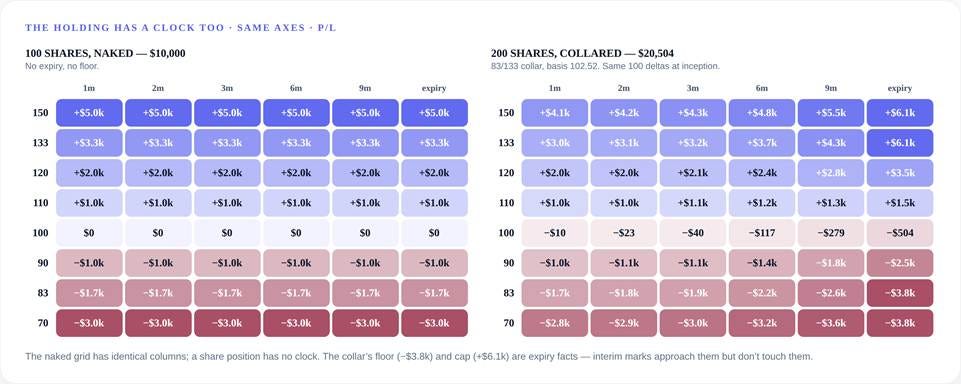
100 shares naked vs 200 collared shares (the delta-matched position), marked through the year.
Let’s compare the delta-matched collar to the naked shares directly by subtracting the null position, the same move as the call chart:
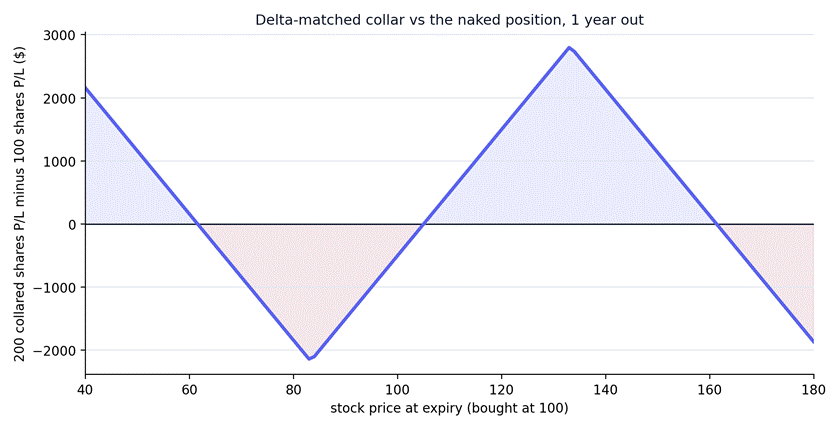
200 collared shares minus 100 naked shares, at expiry. Crossovers at 62, 105, and 161.
Same wings-versus-belly trade, except the wings are clipped. Four regions:
- Below −38%: the collar wins, and keeps winning the further down you go. This the put you own paying off.
- −38% to +5%: the naked position wins. The swap’s worst spot is the stock pinned at the put strike, where you’ve taken the full 2× ride to the floor, but the insurance hasn’t paid. You reach your maximum loss faster than the naked holder reaches the same dollar loss.
- +5% to +61%: the collar wins, peaking at the call strike, up $6.1k against the shareholder’s $3.3k.
- Above +61%: caps are caps. The naked share position wins as it retains the full upside.
The collar represents a more specific view than just being long: a desire to stop out the left tail, while betting on good-but-not-miraculous year, or at least thinking the far upside is not woeth retaining and should be swapped for protecting the downside.
- You are paid a lot more vs the null 100 delta position in the regions where you are right.
- You lose modestly more when the stock is flat or down small.
- You underperform massively in the extreme upside.
- You outperform massively in the extreme downside.
You’re basically adding local leverage but cutting all positions once the stock has traveled far in either direction.
semi-bluff
In poker, a semi-bluff is a bluff with outs. For example betting or raising into a hand that is likely better than yours while you are on a draw (for example, you have 3,4,5,6 and have 8 cards that would complete a straight but you’re currently behind because you suspect you’re opponent has a medium pair like 10’s). It’s not a total bluff because your hand has hope to improve enough to win, but you can also win immediately by scaring them out giving multiple paths to victory.
If you have a directional view, but also a vol view (you think the vol is cheap, like my nat gas example earlier) your expression of the trade could tilt towards using options instead of just buying the stock.
Assuming you have a directional view in mind, your flowchart:
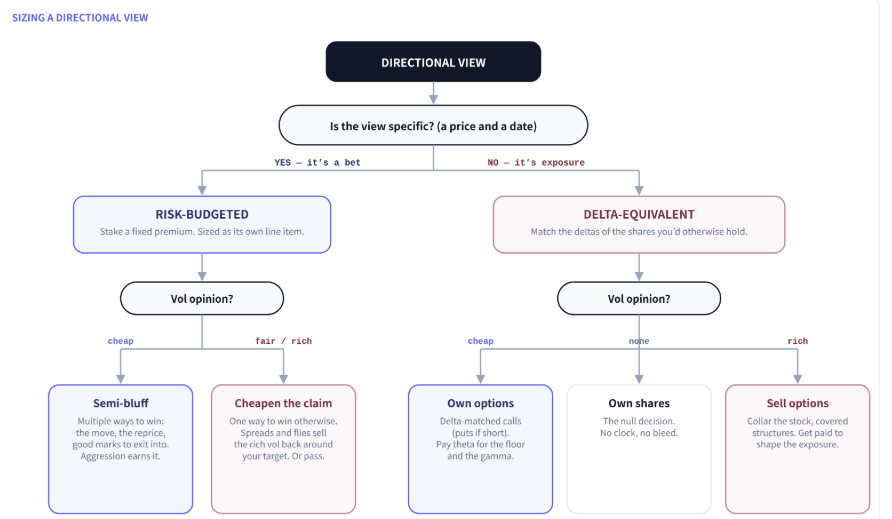
How this fits into your existing investing framework
Examine your existing portfolio. Every position can be classified on the spectrum of a specific thesis/horizon or vibey. Most of mine are vibey asset allocations I maintain within some band.
When I get a more specific view or vol surfaces offer a compelling trade I will substitute or overlay an option expression into the portfolio. Delta-equivalent sizing is a natural way to move from vanilla delta expression to an option expression. For example, if you have a $1mm portfolio and 5% of that is in AAPL then your option-based substitution would still just be $50,000 of length. That could mean owning $100k of stock plus 3 .50 delta puts.
Rough math:
- AAPL is $300
- 1 .50 delta put is equivalent to -50 shares (don’t forget option multipler is 100)
- $300 * -50 = -$15,000 so 3 puts = -$45,000 worth of AAPL
$100,000 of AAPL stock - $45,000 AAPL exposure = $55,000 or ~ 5.5% of a $1mm portfolio.
The key is that your sizing of AAPL came from your portfolio weight decisions which is upstream of any option consideration. The option arithmetic happens at the security level and inherits from your portfolio targets.
The risk-budgeted trade can run as its own small sleeve or crowd out some of the exposure if you prefer. For example, if you own AAPL but want to take risk budgeted view on earnings, the bet could be used to add risk or you could substitute by trimming some of your AAPL length.
Personally I think adding the risk on instead of substituting will usually make more sense because option exposures, unlike stock exposures, vary simply due to the passage of time. If you own OTM calls and the stock is chopping around in a tight range, those calls are losing their deltas and you are less long than you used to be. This highlights the big caveat to this whole post:
Delta-equivalent sizing is a snapshot. Your position in option contracts is going to be larger or smaller in risk terms (notably delta) depending on where the stock goes and time remaining until expiration. This is also true for the risk-budgeted trade, but in that case your opening mindset was “set it and forget it”. Since the delta-equivalent trade was meant to be a stock substitution, you will likely prefer to keep checking if the real-time exposure is close enough to the target exposure. Depending on your tolerance for variation from that exposure, you may need to rebalance. If the maintenance of a delta-equivalent option position is burdensome, you should raise the bar significantly for when you should consider it, or avoid it altogether.
Recap
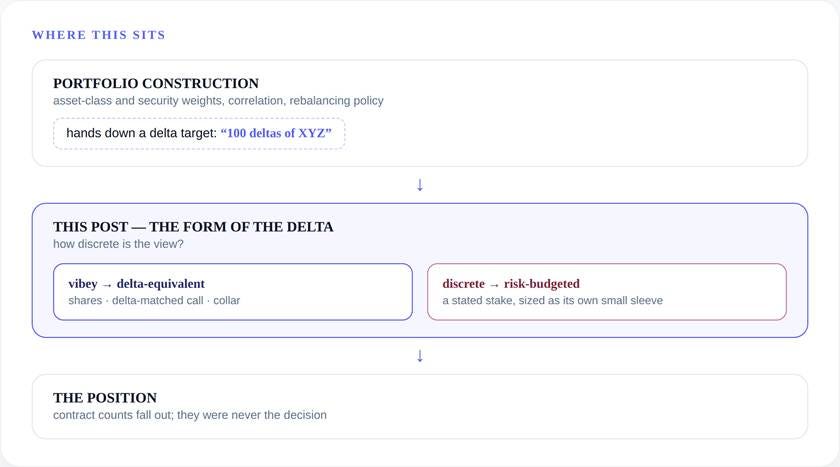
Picking up from the point where you have a directional view:
- Choose the form:
- risk-budgeted for specific views
- delta-equivalent for vibey views
- The contract count is a residual that falls out:
- the dollar risk budget allocated to the bet (you could use a discrete betting framework such as Kelly or if you have a lot of trading experience feel likely gets you in the right ballpark)
- desired delta inherited from target portfolio allocation
Appendix
Conventions
One world throughout:
- $100 stock
- 35% ATM vol
- zero carry
- Black-Scholes, 1-year instruments. Every grid marks the position at elapsed times (1m, 2m, 3m, 6m, 9m) with vol held flat; the expiry column is intrinsic value. No rebalancing anywhere.
The call
- 1-year 110 strike at 35 vol: premium $10.12, delta 0.461.
- Risk-budgeted: $10,000 ÷ premium = 9.9 contracts.
- Delta-equivalent: 100 deltas ÷ 46.1 per contract = 2.2 contracts for $2,194, remainder in cash earning nothing
The collar
- Single-name skew: put IV = 1.07 × ATM (37.5), call IV = 0.97 × ATM (34.0). Legs are the exact .25-delta strikes, 83.3 and 133.2.
- Net cost $2.52 rolls into basis (102.52). Floor 19.2%, cap 30.7%, R:R 1.60
- Net inception delta 0.50.
- Interim marks use the same skewed vols on the remaining tenor.
- Parity check: C(83.3) = $23.53, C(133.2) = $4.32, spread $19.21 + $83.30 cash = $102.51 = basis.