

This week on The Options Trench I explained that I was going to buy TIPs. The video is a presentation on the mechanics of TIPs, how to interpret their yield, the risks, taxation, common misunderstandings, and why they are so interesting right now. The episode is a full hour and features slides, so hopefully it becomes a great reference for when you need to brush up.
📺Everything You Ever Needed to Know about TIPS Bonds
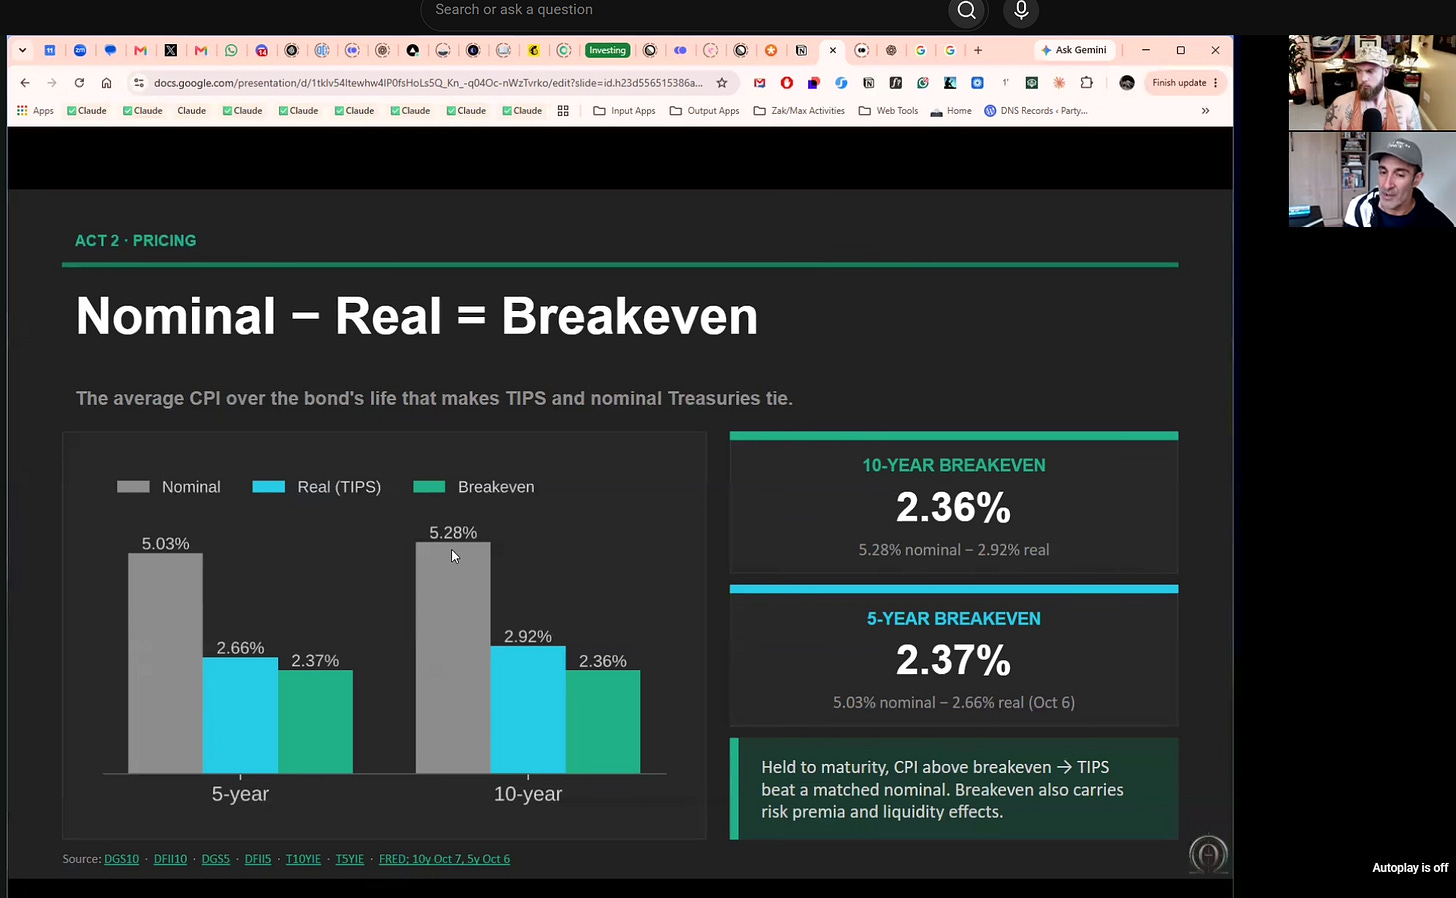
Recent pricing:
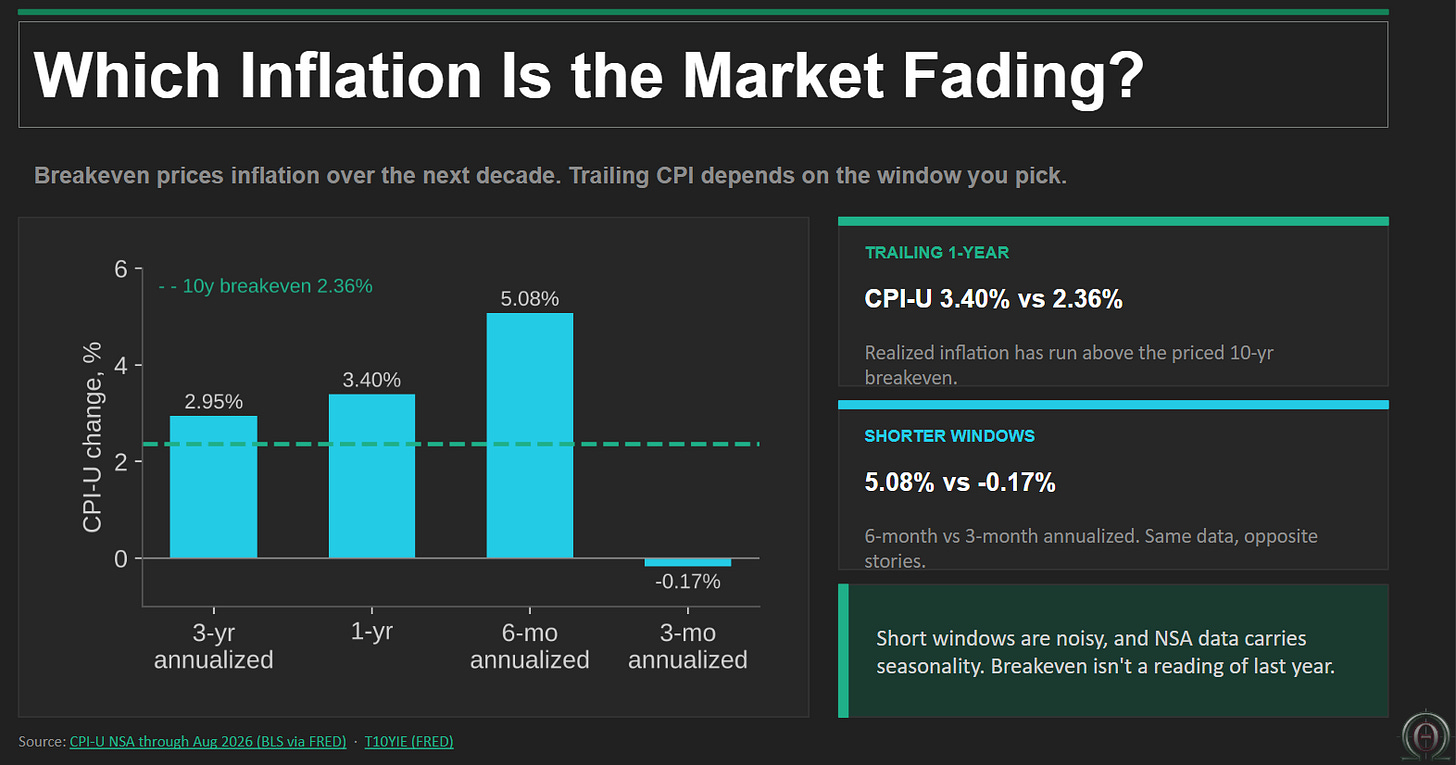
While the video offers the rationale for buying them as well as how I’d manage the position from an asset allocation point-of-view, this post forces you to think like a portfolio manager stacking risk premiums.
We are going to stack TIPs with oil into a 2-asset portfolio, per the replicator idea*.
The moving parts make it a rich teaching canvas for edge, sizing and dynamic management. The pairing adds a surprising amount of expected return for very little extra risk. But as the trade ages, competing forces take over:
- the position gets riskier just by being held,but…
- the risk shrinks when you’re losing and swells when you’re winning
The risk premiums fit well together and for sensible reasons given what has happened in 2026.
There’s a lot to learn in this one.
*Refreshers:
Inflation Replicator | 8 min read
stacking carry: an inflation hedge you get paid to own | 14 min read
Let’s begin with the concept and the market inputs.
Two risk premia
Measuring E[r] or the expected carry
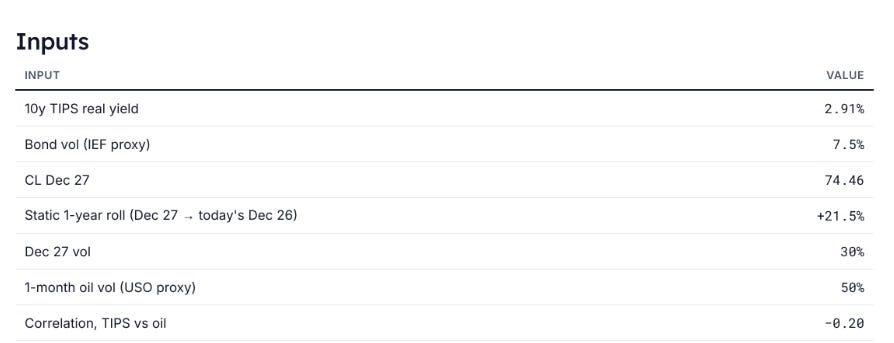
- TIPS: 2.91% + CPI growth.
- Oil: long CL Dec 2027 at 74.46 (snapshot Oct 12 intraday). If today’s curve shape holds, in 1 year it trades where Dec 26 trades today, 90.49: +21.5% static roll
Measuring the risk
For our volatility inputs, we will use 1-year implied vol for WTI futures options and IEF options as a proxy for 10-year-note vols. We also need 1-month oil futures vol, which we can proxy from USO 30d implieds and an estimate of correlation between oil and notes.
Let’s take them in turn:
A vol for TIPs
Vol is elevated in bonds now, but we are going to put faith in market pricing and use the 1-year IEF implied vol as a proxy for 10-year TIPs. A more typical 1-year vol would be about 6%.
- 7.5% [IEF via moontower.ai]
A vol for Dec 27 WTI futures
- Dec 27 IV ~ 30% [Barchart CLZ27 chain]
- 1-month oil vol ~50% [USO via moontower.ai]
🔄️Samuelson effect
Be careful! Each expiry is its own underlying. 12-month vol is not front-month vol spread over more time.
Mar 9, 2026: M1 RV 66.9% vs M12 RV 18.7%. CME constant-maturity 1M IV was 3.5× the 12M.
A 12-month contract carries a fraction of front-month vol today and picks up front-month vol as it ages. Today’s gap is 50% in the one-month vs 30% for a year out.
Learn more about these variance ratios:
🔗oil options and the raw gamma paradox | 12 min read
🔗crossing the commodity chasm | 13 min read
Correlation
We need a correlation between oil and Treasury notes to measure our portfolio vol. We will use IEF and USO as proxies. While we have tools in moontower that directly analyse pairs, I just asked the agent, which is connected to the data:
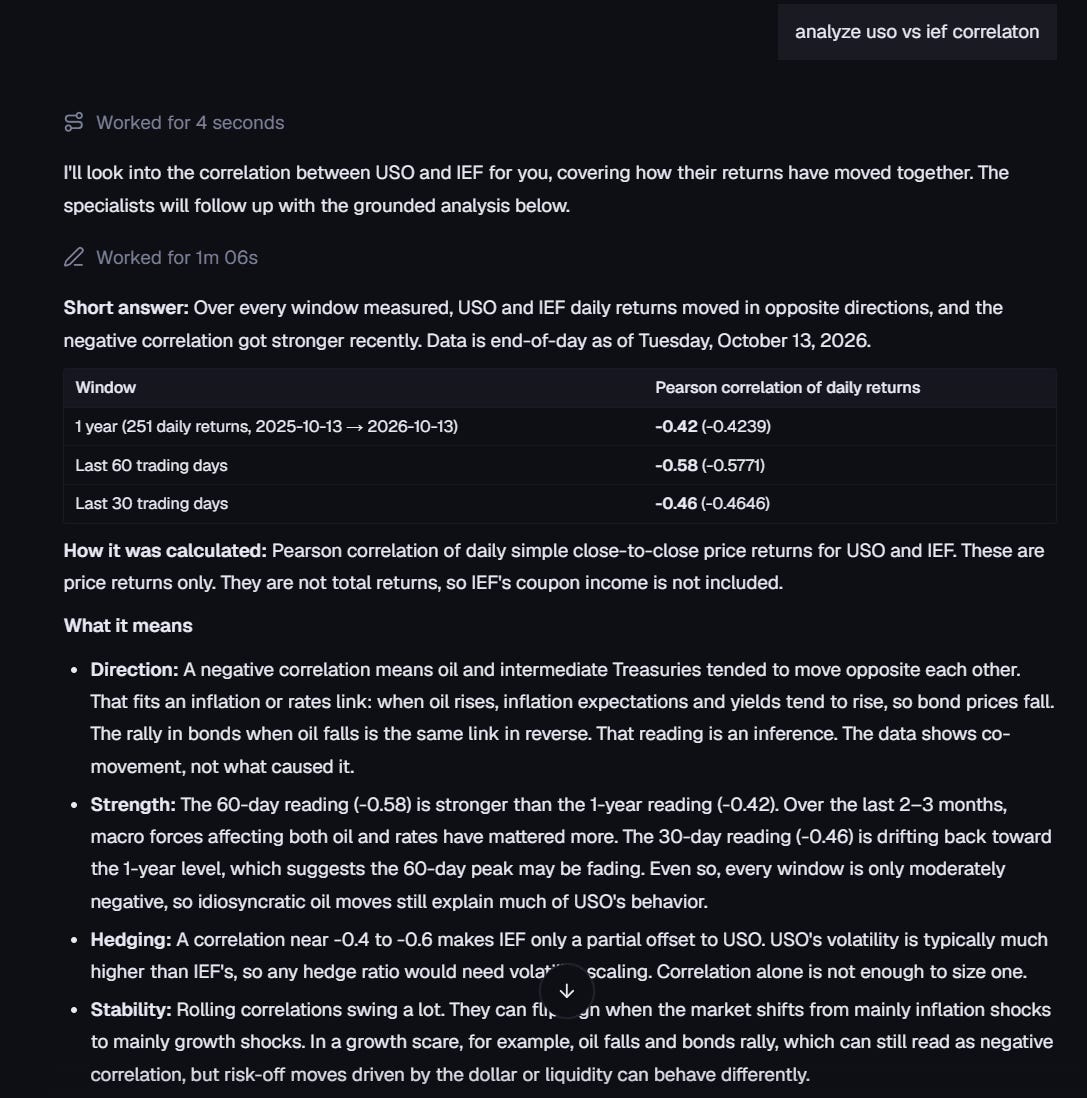
From this, we can estimate a correlation of -.50
But I’m hesitant because this is such a sharply negative correlation, and portfolio vol is very sensitive to its value. Let’s be extra careful measuring correlation between IEF and USO and TIP vs USO.

Ahh, this yields a more conservative assumption. Let’s use -.20 correlation.
Summary:
Sizing
This is a dynamic trade. Because of the Samuelson effect, the vol you size with today is not the vol you hold in, say, 9 months. This mirrors the carry. The slope of the oil futures curve is steepest in the front, offering a higher expected roll return, but for contracts that are more volatile. We can probably decompose this curve into some concept of Sharpe per month (ie how much does the monthly reward erode relative to the erosion of variance as you go further in time), but this is not an attempt to trade the slopes directly.
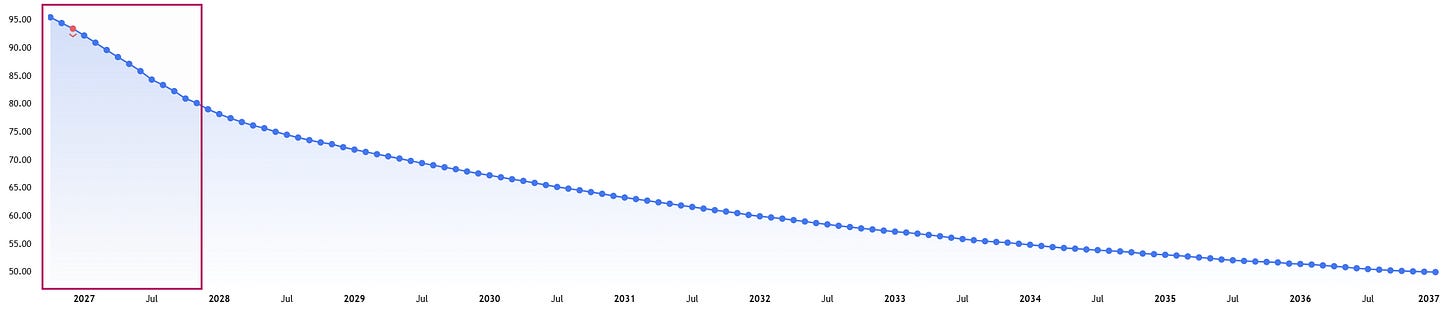
The vol path here is stylized:
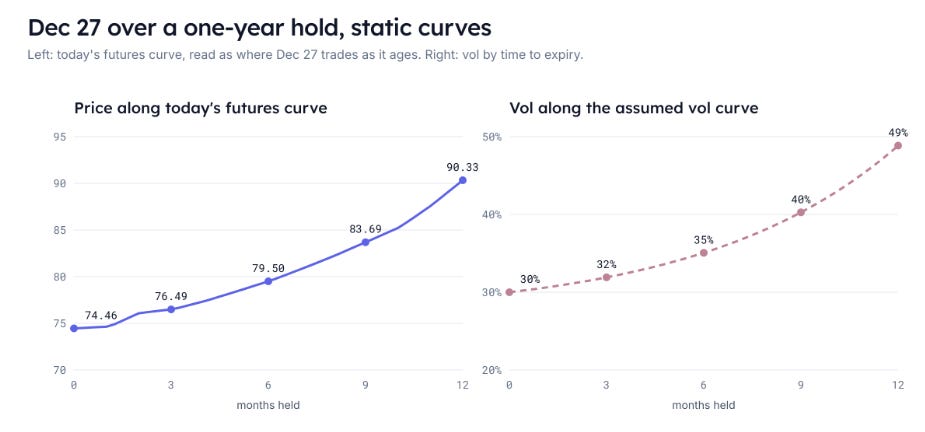
The key takeaway is that your reward and risk are both increasing per unit of time as the position ages.
Still, we must size for the initial risk.
Let’s assume we have $1mm to allocate to this portfolio of TIPs and oil. We will use inverse vol weighting so each leg carries the same dollar risk.
- Add the vols: 7.5% + 30% = 37.5%
- Each leg’s share of that total: oil 30% ÷ 37.5% = 80%, TIPS 7.5% ÷ 37.5% = 20%
- Invert to get the weights (the riskier leg gets the smaller weight): oil 20%, TIPS 80%
- On $1mm: TIPS 80% = $800,000, oil 20% = $200,000 notional
- Check: TIPS $800,000 × 7.5% = $60,000; oil $200,000 × 30% = $60,000
- One CL = 1,000 bbl × $74.46 = $74,460 → $200,000 ÷ $74,460 = 2.69 contracts
Portfolio vol at inception
σp = √(σT² + σO² + 2ρ σT σO)
where:
σp = portfolio dollar volatility (annualized)
σT = NT × vT = TIPS notional × TIPS vol
σO = NO × vO = oil notional × oil vol
ρ = correlation between TIPS and oil
σₚ² = ($60,000)² + ($60,000)² + 2 × (−0.20) × $60,000 × $60,000
= 3.60B + 3.60B − 1.44B = 5.76B
σₚ = √5.76B = $75,895 (7.6% of $1mm) vs $75,000 (7.5%) for $1mm of TIPS alone
Notice how substituting 20% or $200k of the portfolio with negatively correlated oil barely budged vol versus a 100% TIPs portfolio!
That story is going to get a bit better than a bit worse in a second.
First, the better part:
Expected carry at inception (assume we move along a static futures curve)
TIPs
Although we are choosing TIPs over nominal bonds, that’s a decision that lives outside the risk and reward analysis. I decided that inflation breakevens of 2.33% tilted me towards TIPs. Those breakevens are probably fairly priced, so that sets the expected return of TIPs equal to the nominal 10-year rate of 5.24%
Therefore TIPs contribution to portfolio return =80% × 5.24% = 4.19%
Oil
20% × 21.5% static roll = 4.30%
Therefore:
Portfolio E[r] = 4.30% + 4.19% = 8.49%
The ratio of reward to risk for the portfolio = 8.49% / 7.6% = 1.12
Compare that to TIPs alone: 5.24% / 7.5% = 0.70
[Note: the futures don’t use the full $200k; the spare cash posted as collateral would also earn T-bill yield. Left out to keep carry = the two premia.]
But there’s bad news. Remember, oil requires you to tolerate higher volatility per the Samuelson effect to ride up that futures curve.
Let’s watch the trade age and see how risk and reward cash out.
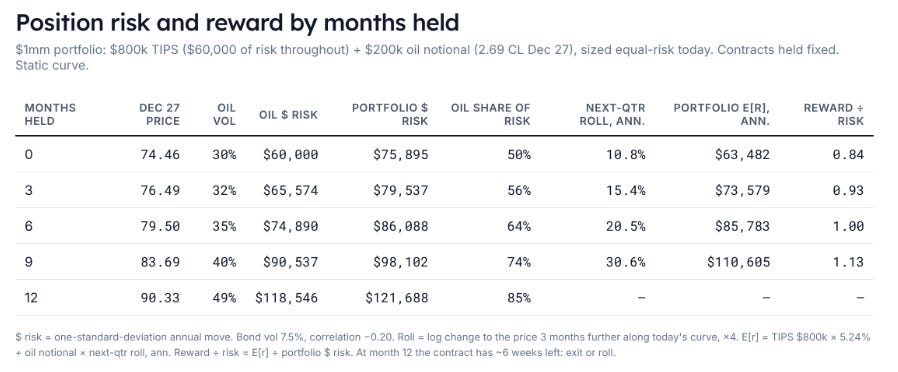
Risk path (no rebalancing)
Portfolio vol: 7.6% → 8.0% → 8.6% → 9.8% → 12.2% (months 0, 3, 6, 9, 12).
Oil’s share of risk explodes from 50% → 85%.
Worked example @ month 6
- Static curve: after 6 months Dec 27 has ~7.3 months left, so it trades where a 7.3-month contract trades today: $79.50
- Oil notional = 2.686 × 1,000 × $79.50 = $213,533
- Oil vol at 7.3 months (stylized path) = 35.1% → oil $ risk = $213,533 × 35.1% = $74,890. TIPs risk is still $60,000 as there is no assumption that vol will change.
- σₚ = √(60,000² + 74,890² + 2 × (−0.20) × 60,000 × 74,890) = √(3.60B + 5.61B − 1.80B) = √7.41B = $86,088 (8.6% of $1mm)
To compute oil’s share of the risk, we must remember that portfolio variance has three pieces:
σₚ² = σ_T² + σ_O² + 2ρσ_Tσ_O
- σ_T² belongs to TIPS.
- σ_O² belongs to oil.
- The cross term 2ρσ_Tσ_O belongs to both, so each leg gets half: ρσ_Tσ_O.
Oil share of risk = (74,890² + (−0.20) × 60,000 × 74,890) ÷ 7.41B = (5.61B − 0.90B) ÷ 7.41B = 64%
Reward ÷ risk at each snapshot (annualized, next quarter)
The table answers:
If the next 3 months look like a static roll, what’s the portfolio earning per year per dollar of risk?
- Next-quarter roll, annualized = ln(price 3 months further down the curve ÷ price now) × 4
- Oil E[r] = oil notional × that roll
- Portfolio E[r] = TIPS $41,920 + oil E[r]
- Reward ÷ risk = portfolio E[r] ÷ portfolio $ risk
Month 0: ln(76.49 ÷ 74.46) × 4 = 0.0269 × 4 = 10.8% → $200,000 × 10.8% = $21,562 → $41,920 + $21,562 = $63,482 → ÷ $75,895 = 0.84
Month 6: ln(83.69 ÷ 79.50) × 4 = 0.0514 × 4 = 20.5% → $213,533 × 20.5% = $43,863 → $41,920 + $43,863 = $85,783 → ÷ $86,088 = 1.00
By quarter: 0.84 → 0.93 → 1.00 → 1.13.
Risk rises as the contract ages, but the roll rises faster because the inverted futures curve is steepest in the front.
The 1.12 risk-reward we computed at inception is too rosy because it spreads the year’s roll evenly and holds risk at its starting 7.6%.
- The roll is back-loaded. Next-quarter roll, annualized: 10.8% → 15.4% → 20.5% → 30.6%. Today’s next-quarter ratio is 0.84, not 1.12.
- Risk grows. Averaged over the year (√ of the average monthly variance), portfolio vol is $88,824 = 8.88%, not 7.6%.
Full year held: carry (8.41%) ÷ average risk 8.88% = 0.95 is still well above TIPS alone (0.70)
Hold or rebalance halfway?
A static position lets risk build as oil picks up volatility. If you rebalance, it cuts risk but forgoes the steepest part of the roll.
We’ll jump to the conclusion and explain below:
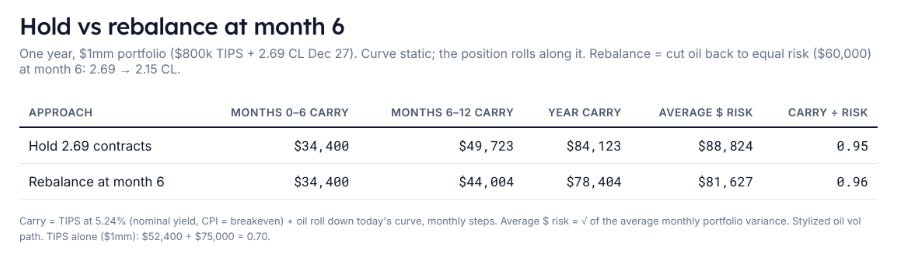
Case 1: hold 2.69 contracts all year
- Carry: TIPS $41,920 + oil roll $42,203 = $84,123 (8.41%)
- Average risk $88,824 (8.88%) → 0.95
Case 2: rebalance to equal risk at month 6 when oil vol is 35.1%
- Month 6 oil $ risk has grown to $74,890 vs TIPs $60,000
- Contracts for equal risk = $60,000 ÷ ($79.50 × 1,000 × 35.1%) = 2.15 → sell 0.54 contracts
- Carry: first half unchanged ($34,400); second half $44,004 vs $49,723 held → year $78,404 (7.84%)
- Second-half average risk $83,951 vs $97,475 held → year average $81,627 (8.16%)
- Carry ÷ average risk = 7.84% ÷ 8.16% = 0.96
The trade-off: rebalancing gives up $5,719 of carry (−6.8%) to take $7,197 off average risk (−8.1%). Second half alone: carry −11.5%, risk −13.9%.
It’s close to a wash on carry per unit of risk (the impact of the curve shape is key to the comparison). But you are holding more risk into the final months so even if the risk-reward is similar the net has changed.
A wrinkle that may lower the risk
Oil put skew generally looks like equities, with OTM put implied vols trading at a premium to the OTM call IVs.
This is the 30-day .25 delta risk reversal for USO (purple line). Notice how the puts went to a large discount relative to the calls in 2026 as the skew inverted.
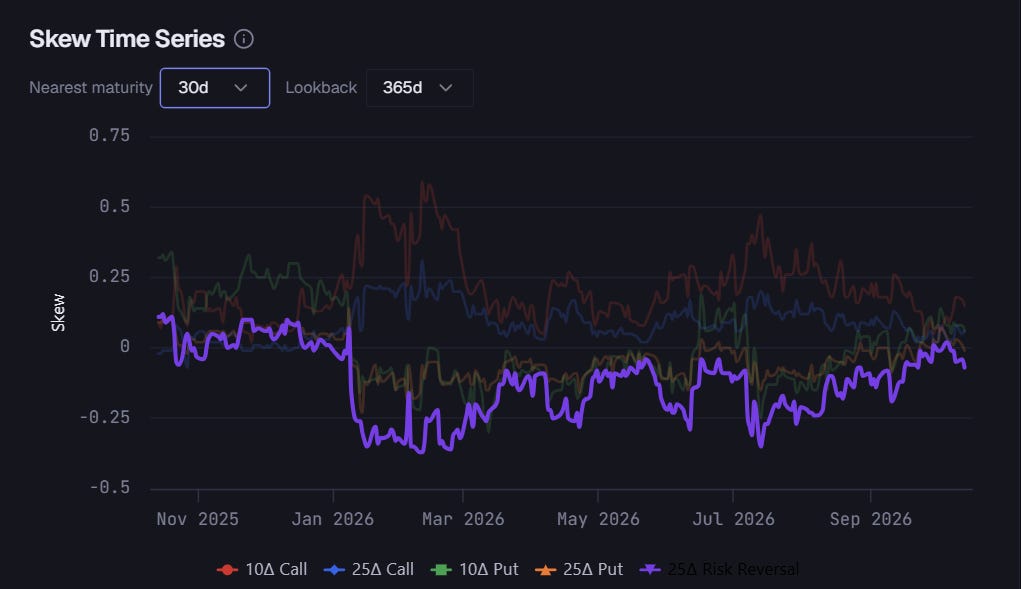
The further you go out in time in the futures options, the more typical the skew becomes with 1-year OTM puts trading at a premium to equivalent delta OTM calls. This makes sense as both longer-dated futures and options surfaces will reflect producer hedging flows.
The war has created a spot up-vol up regime. This is a noisy fit, but it’s good enough to take us where we are going.
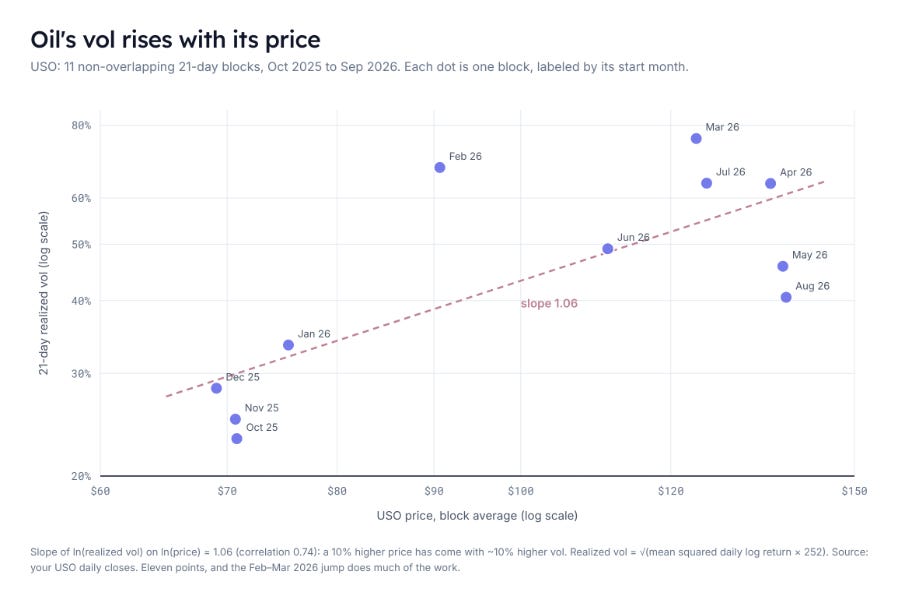
We estimate an elasticity or beta to how much realized vol changes for changes in USO by regressing ln(USO 21-day realized vol) on ln(USO price) over 11 non-overlapping blocks. This yields a slope of 1.06.
So what happens if oil drops 20%?
- Your starting $200k oil position falls 20% → $160,000
- If price falls 20%, vol falls approximately by 20%*1.06 or 21.2%. 30% -.212*30% = 23.64%*
- Oil $ risk = $160,000 × 23.64% = $37,824
- σₚ = √(60,000² + 37,824² + 2 × (−0.20) × 60,000 × 37,824) = √(3.60B + 1.43B − 0.91B) = √4.12B = $64,210 = 6.4% of $1mm (vs 7.6% base)
Whether it’s this example or any asset in which spot and vols are positively correlated, be aware of how this amplifies risk to the upside and dampens it to the downside. In this example oil $ risk scales with price × vol ≈ price¹ × price¹·⁰⁶ ≈ price²
In other words, if the asset increases by 10%, your risk increases by ~1.1² or 21%.
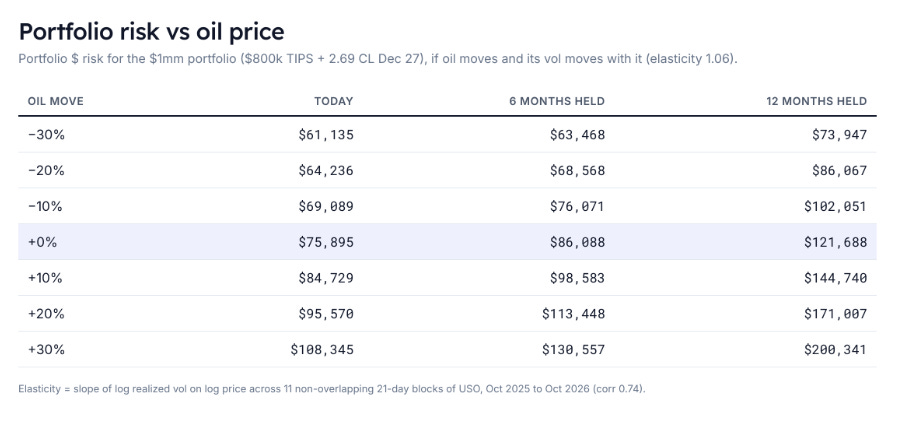
If oil moved ±20% in the early part of the holding period, then your portfolio vol would be 6.4% (down state) or 9.6% (up state) of $1mm (base 7.6%).
If the move happened in the last month of the 1-year holding period, the respective change in portfolio vol ±20% is 8.6% (down state) vs 17.1% (where the base is 12.2%)
The asymmetry works to your advantage. An oil rally both enlarges the leg and raises its vol, so risk accelerates when the position is winning and vice versa.
*Why approximately?
Start from the fitted line:
ln(vol) = a + 1.06 × ln(price)
Step 1: turn the log side into a power.
A rule of logs: b × ln(x) = ln(xᵇ).
→1.06 × ln(price) = ln(price¹·⁰⁶)
and the line becomes:
ln(vol) = a + ln(price¹·⁰⁶)
Step 2: raise e to both sides.
Since e^(ln x) = x, this undoes the ln:
e^(ln(vol)) = e^(a + ln(price¹·⁰⁶))
The left side is just vol.
Step 3: split the right side.
A sum in the exponent becomes a product: e^(x + y) = eˣ × eʸ.
→ vol = eᵃ × e^(ln(price¹·⁰⁶)) = eᵃ × price¹·⁰⁶
eᵃ is just a constant; call it C:
vol = C × price¹·⁰⁶
Step 4: compare two prices.
Write it out at today’s price and at a new price:
vol₀ = C × P₀¹·⁰⁶
vol₁ = C × P₁¹·⁰⁶
Divide the second by the first. The C cancels:
vol₁ ÷ vol₀ = P₁¹·⁰⁶ ÷ P₀¹·⁰⁶ = (P₁ ÷ P₀)¹·⁰⁶
Step 5: rearrange.
vol₁ = vol₀ × (P₁ ÷ P₀)¹·⁰⁶
Plug in oil down 20%: vol₀ = 30% and P₁ ÷ P₀ = 0.8, so
vol₁ = 30% × 0.8¹·⁰⁶ = 30% × 0.789 = 23.7%
A word on taxes
- TIPS in the IRA: inflation accrual is taxed yearly in taxable (phantom income).
- CL futures: Section 1256, marked to market Dec 31, 60/40.
- Losses don’t net across accounts.
What we learned
- Inverse-vol sizing takes three steps: add the vols, take each leg’s share of the total, then invert. Vols of 7.5% and 30% give an 80/20 split.
- A high-carry, negatively correlated asset can be nearly free in risk terms. 20% in oil took portfolio vol from 7.5% to 7.6%.
- Each futures expiry is its own underlying. Because of the Samuelson effect, a long-dated contract picks up vol as it ages, so a position gets riskier on its own. Portfolio vol went from 7.6% to 12.2% over the year, and oil’s share of the risk from 50% to 85%.
- Carry and risk are both back-loaded. The 1.12 reward-to-risk at inception spreads the roll evenly and freezes risk at day one. Over a full year of holding, it’s about 0.95. That’s still well above TIPs alone (0.70).
- A leg’s share of risk isn’t its share of dollar vol. The correlation term is split between the legs, which is how oil reached 64% of portfolio risk by month 6.
- Rebalancing is a trade-off, not a free lunch. Trimming oil back to equal risk at month 6 gave up 6.8% of carry to cut average risk by 8.1%: about the same efficiency, but less risk going into the final months.
- When vol rises with price, dollar risk scales with roughly price². With an elasticity of 1.06, a 20% oil rally takes portfolio vol from 7.6% to 9.6%, while a 20% drop takes it to 6.4%.
- Account placement. TIPs go in the IRA to avoid tax on phantom income; futures go in a taxable account for 60/40 treatment.