

Yesterday’s post offered some market thoughts and the following backdrop heading into the Fed meeting after the Jackson Hole Keynote 3 weeks ago:
- The chance of a 25 bps hike shot from 35% to 90%
- The 10-year yield is up 20 bps
- Oil is up 25%
- The 30-year yield is flattish
- Equity indices are down less than 2%
- EEM is down 2.7%
- Gold is down 7%
- BTC is down 5.5%
Let’s ignore oil as it’s not directly Fed-related.
The significant moves here have been gold which is about 1.5 standard deviation change in that period and the 10-year note which is closer to 2 standard deviations. These things care about the Fed meeting.
This is a trader post. We’re not doing fundamental analysis. We’re thinking like gamblers looking at point spreads for something that sticks out. The benefit of having deep fundamental context would be in being able to explain why a strange point spread might look offsides. If you are reading this, that’s your job. I can help you see pricing and offer some logic.
And the end should bridge at least some of you into being able to do this automatically for yourself.
Let’s proceed.
The market sees 2 possible scenarios:
Hike
This is 90% priced in. If it happens, there’s not much to update. There’s a modest bid to the Wednesday expiry because of the meeting. Actually, let’s step through that quickly for practice.
1-month straddle in SPX is 3.25%, which corresponds to a daily straddle of .0325/√30= 59 bps
The straddle expiring on Wednesday is about 80 bps so there’s still a vol premium associated with this event. We’ll come back to that.
No hike
The surprise.
Bullish gold, silver, BTC, 10-year notes (IEF), EEM (via dollar weakening)
Every one of these is implying a vol premium for the Fed meeting.
I suspect no hike is bearish long bonds, since the lack of discipline plus momentum could get ugly, overwhelming any mechanical rate-cut effect, but this is conjecture. Curve steepens. Probably? I don’t know.
[I thought to look at XLF in case curve steepening would be bullish, but XLF has moved less since Jackson Hole than equities broadly and has a tiny vol premium for this week. The market doesn’t seem to think the decision matters for it. Seems strange but ok.]
Skewness
Now again this is more of a skew event than a vol event since the odds of a hike are so lopsided.
We can see the 1-week call skew is well bid in the names I think are most sensitive to the rate decision. IBIT, gold and silver call skews are 90+ percentile (see screenshot), but if you go 90 days out the call skews sit in the middle of their ranges.
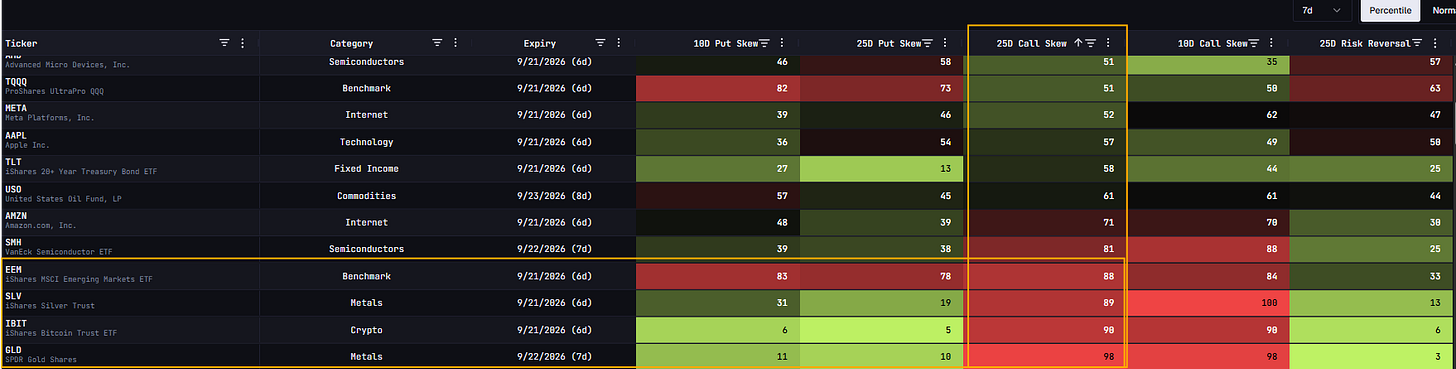
I’d think that stocks could stage a big rally if the reason they’ve been unchanged instead of marching higher was a lid from hike expectations (see yesterday’s post), but SPY call skew doesn’t really care.
This might look like something of a contradiction. The straddle seems to care about this even though it’s almost certainly a nothingburger. Nothing in the price action since Jackson Hole suggests this meeting has a strong binary skew for stocks the way I expect it does for the names that actually price the skew in. But just for fun, let’s pretend it is binary.
I put the 80bps straddle in a moontower calculator and the 10% chance of stocks rallying (corresponding to no cut) and you get the following:
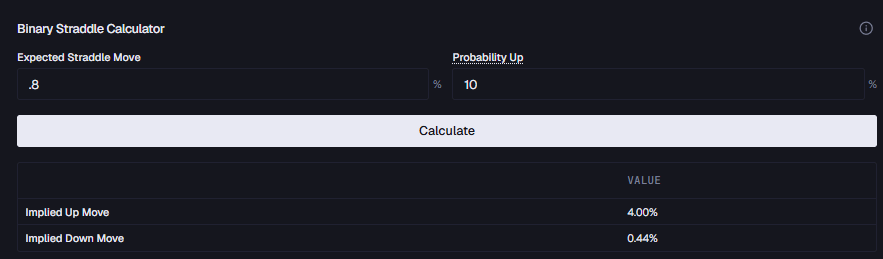
That framing is really just for exposition. Even though the actual decision is binary, the reaction functions aren’t. The decision has a 9-1 skew to it, but the variance is mostly coming from the Fed’s messaging. I emphasize this because becoming a vol trader is a graduation of turning your opinions about the distribution to trade expressions that are levered to the nuance in those opinions.
Musing on some trade ideas (for educational purposes only, I’m not your dad)
Above was my general sense of the market, but this is how it translates to prospecting for trades.
IEF
If the hike doesn’t come, the 10-year will likely give 20 bps back, about a 1.4% rally. Actually, I’d be surprised if it gave it all back. Whatever hawkish reasons were given at the keynote live on, which makes bonds less attractive, not more.
If they do hike, 10-year notes probably don’t do much, so on balance the vol is probably a sale.
With the IEF at 90.87 the Sep18 91 calls are only .23 bid, which break even on a 43 bp rally. The 91 straddle is .59 bid synthetically.
[You can use put-call parity to do that in your head, which is an important skill. Otherwise, you’d be fooled by the fact that it’s only .55 bid if you look at the screens because the 91 put which is ITM, is wider. To not understand this means you tip your local market-maker anytime you trade an ITM option not knowing what its synthetic price was in the liquid option. The most boring truth in the world is that for all the words that get thrown around, understanding penny arbitrage is what built the castles option knights live in.]
If you weren’t too worried about the downside in the near-term, selling the straddle leaves you with a modest long delta (about .12 because the put is ITM) and you win if it rallies less than 65 bps.
A couple posts to help think about short options and sizing
A devilish question for option sellers: Which VRP is higher? 8 min read
options policework 10 min read
Equities
The market is asserting a risk premium on the straddles and skew, which makes sense in the hyper rate-sensitive stuff like BTC, GLD, IEF.
Equities are more of a straddle event, as the messaging may set the tone for risk appetite. But there’s still the highly unlikely but still possible skew event in equities. Let’s break down some thoughts investors might have in the underdog scenario of “no hike”:
5% (50% of the 10%): Nobody cares. The call skew was well-priced. The fact that stocks haven’t made a significant move since Jackson Hole was a useful clue. The near-term straddles evaporate. On to the next ball of yarn.
4% (40% of the 10%): Investors go, “Dollars are toilet paper. We get it, you’re gonna run this thing hot. Discipline’s for alter boys, coupon clippers, and Buffett parrots. Everyone else get in!” Market rips, new highs are in striking distance as it is.
1% (10% of the 10%): Investors go, “Dollars are toilet paper I don’t have as much time to turn them into guns as I thought. I’m out.”
This makes me want to be modestly short near-dated straddles, but own “up” gamma so that I win to disorderly rallies and my exposures go away in a highly unexpected big down move.
This is a short-term betting mentality
None of this cares about the actual drivers (AI capex and prospects being the big one). It’s about the marginal impact of digesting the Fed.
Look, the flip in rate expectations was abrupt. Abrupt enough that 90% seems high, but at the same time, who am I to think my opinion on hike odds is worth a damn. In my way of seeing things, that’s debating a given number in a sudoku grid. I’m trying to find missing numbers. Vols or skews that look off from the bigger picture the liquid surfaces are projecting.
Gameplan
Look for:
- Cheap OTM calls in equities
- Expensive ATM options with premium even beyond what we see in benchmark vols
- Collars in names I’m bullish on where the call skew might be elevated. If there’s no hike, calls fall relative to puts via rho. Collared stock will win both on the rho and because it’s long delta if we rally. In the tiny percent of an “oh crap” sell-off, you’re protected.
I use moontower.ai to screen liquid names only, removing stocks with earnings upcoming.
I run the Trade Ideas algo for names that score well on:
sell vol (for these I’ll look only at ATM options)
buy vol (for these names I’ll intersect the list with those that have cheap call skew)
long calendar (for names where I’d fade the near-term vol bump. I’d look at OTM calls on the long leg, which is called a “diagonal”)
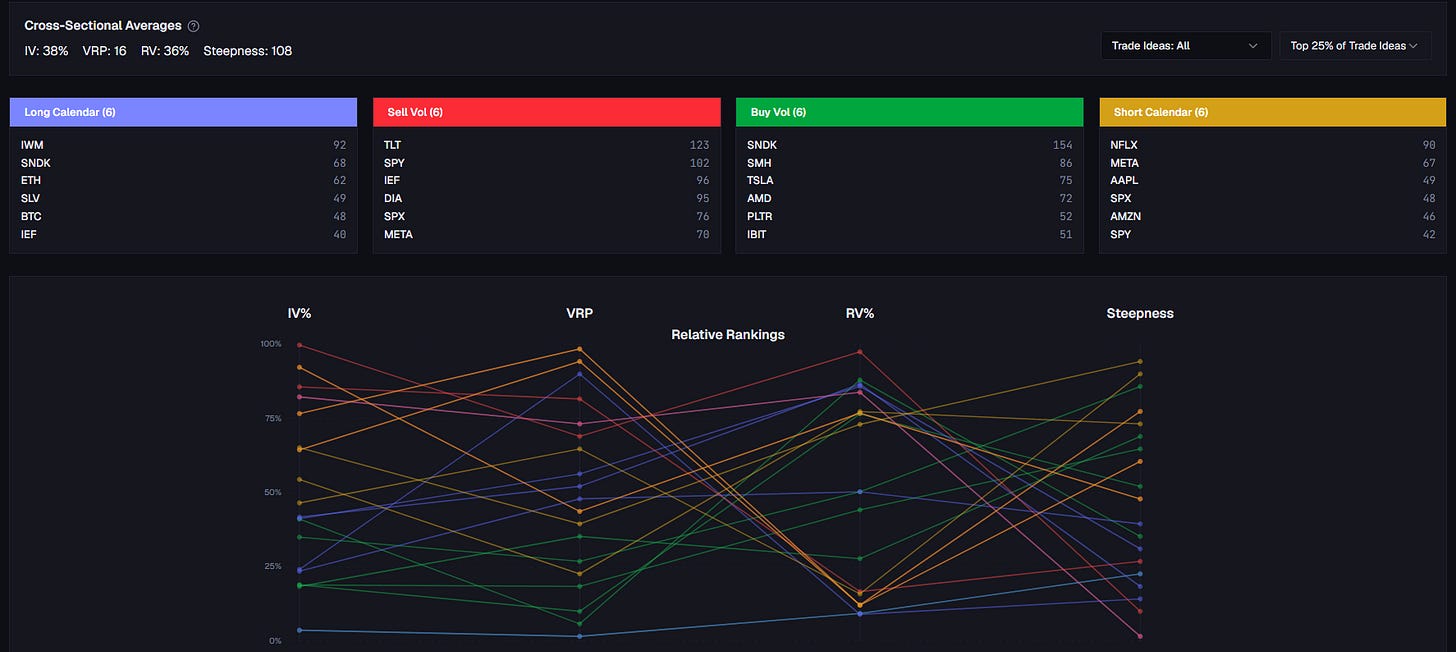
I’ll just step through one example.
Long Calendar Filter
Based on the cross-section I’m looking at notice how BTC, ETH, IEF, SLV score as long calendar candidates. That’s a trap. Those are the names you expect to move the most if there’s no hike. The near-dated vol premium is probably justified.
Let’s dig deeper on another name in the list: IWM.

For readability, I’ll list the attributes:
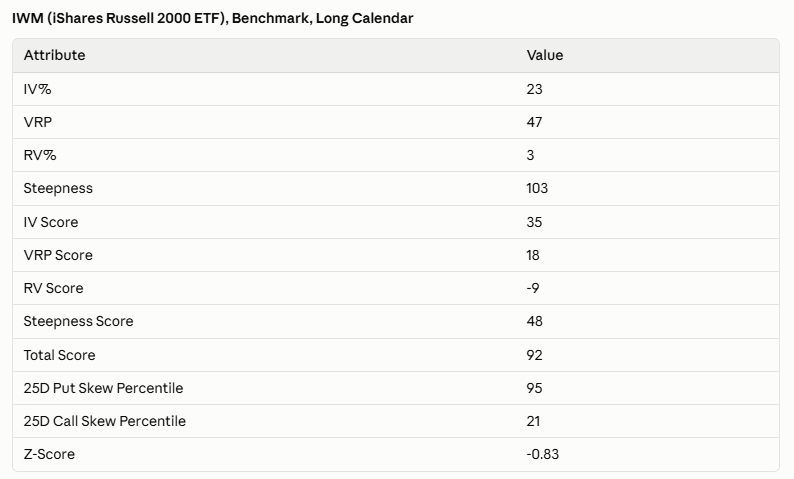
The 30d IV is in a low percentile and 6m options are only 103% of the 1m vols (basically a flat term structure at a low vol).
The vol despite being relatively low (the cross-sectional stats says the average name’s IV is in the 38th percentile) is not carrying well since the VRP is +47 (ie IV/RV ratio is 147%) because the RV percentile is so low.
This setup is why the algo (the various “scores” are outputs of the computation and don’t mean anything in absolute terms) likes IWM as a long calendar candidate. You lock in buying low IV for a term while harvesting the fat VRP.
Counterintuitive subtlety
The low RV percentile actually detracts from the composite score (the RV score is -9) because this is a coiled spring! You expect RV to increase. You’d rather sell high vol at a fat VRP above an already elevated realized vol. Good luck finding that. One glance at our analytics and you’ll see how rare that it is. It usually only occurs when risk is perceived to be more systematic.
Notice that the call skew is also in a low percentile. This is a solid candidate for that diagonal.
You can structure the trade in any number of ways. Short ATM straddles or calls expiring in the next few days or weeks, long Dec or Jan OTM calls. You can ratio the calls. The specific options you choose will depend on liquidity, deltas you want to end up with, your preference on timing (Dec option vs Jan option) or letting the pricing dictate (ie forward vols between months although this is pretty fine-grained and likely won’t overwhelm your bias to specific time preference).
[The specifics make more sense to explain on a stream so you can see the train of thought rather than write it up. It feels like writing the instructions to serve a tennis ball. It’s the wrong transmission mechanism.]
Unlock
Now some of you will have figured this out already, but if you just copy everything I have written up to this point and paste it into an LLM equipped with moontower analytics, you can just say “Using the framework in this article, find me more trades”.
I have Claude connected to the moontower MCP and I give it some guidance on aesthetics and columns…voila:
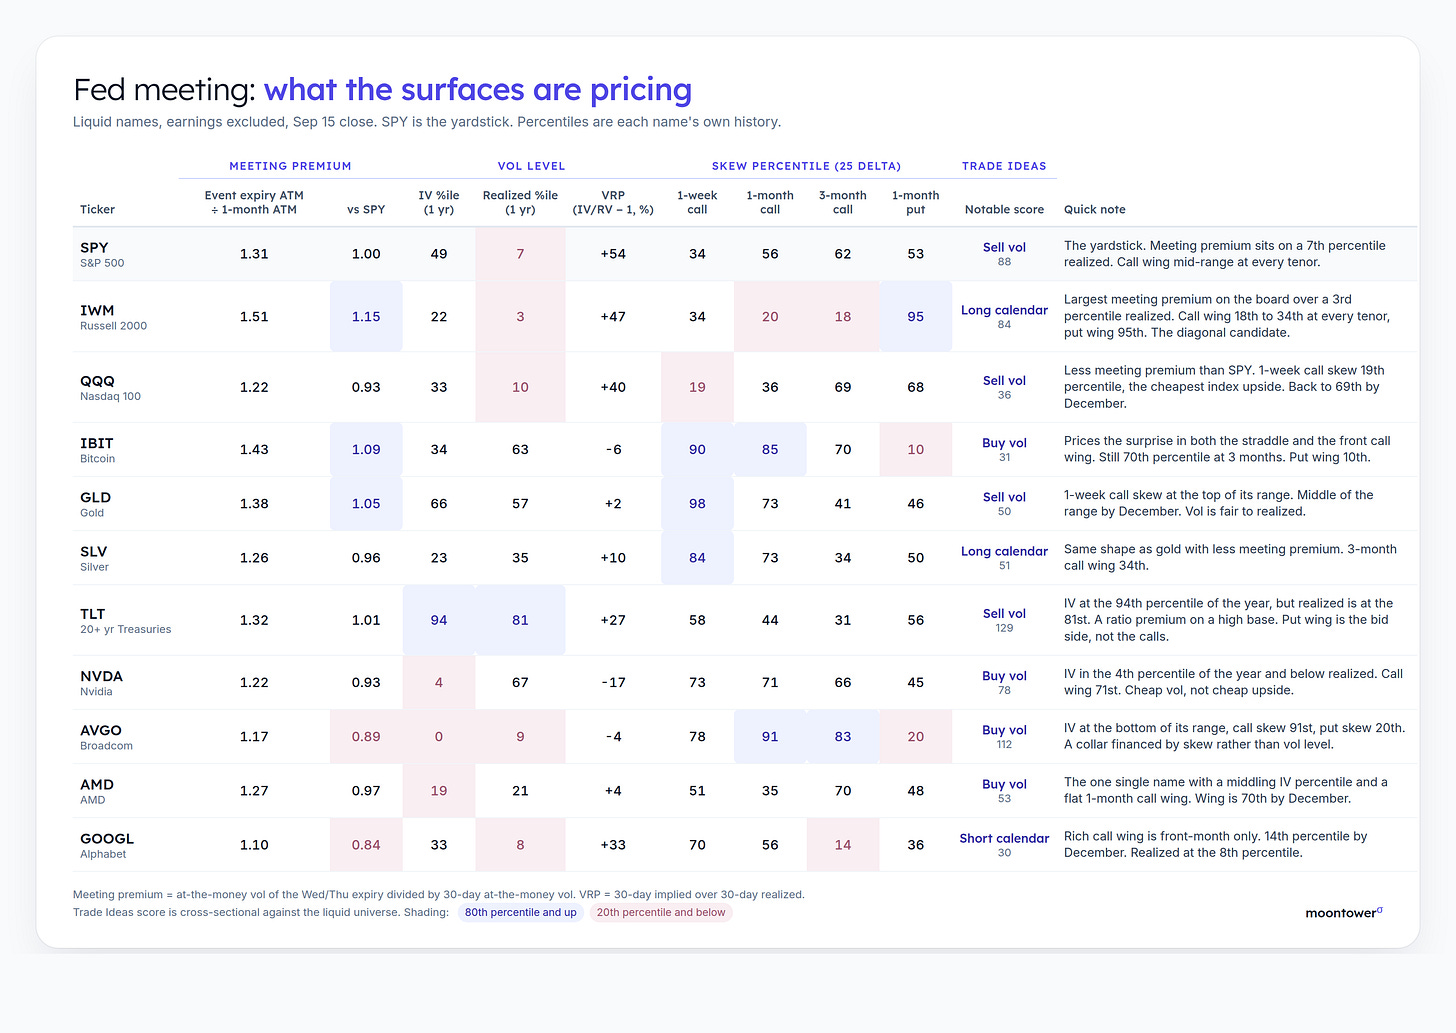
Now rewind a moment to the IWM trade. As you build a portfolio of bets you could now sprinkle in your own research. You can now make judgements like instead of executing both legs of the IWM diagonal, you may say “I like the short IWM straddle leg” but I like buying longer-dated AMD calls which screen as cheap and I like AMD length for x, y, and z reasons. Now you are giving your opinions an arsenal of weapons from cannons (levered directional positions) to fine Japanese blades to carve and shape.
[As a user of 8 widescreens plus a couple tablets at my peak, I say this with mixed sentimentality: One way to see the evolving tech is that discretionary trading used to take many monitors to see the battleground and armory but eventually it’ll be glasses, a mic and a headset.]
I’m gonna leave it there for today because if I did my job right today you have a lot to digest on the subject of trade prospecting.