

Stan Drunkenmiller has been in the news recently for his WSJ op-ed. Besides its message, much is being made of his use of AI to write it. While I’d prefer he didn’t use AI to write, it’s preferable to him saying nothing at all.
[It’s not enjoyable to read AI writing if you can tell the difference, and while I’m sure all of you, an audience that is self-selected into this letter, can, I’m quite bearish on the general population’s level of discernment.]
But today’s letter isn’t about his message. It’s about discretionary trading. When you hear that phrase, “discretionary trading”, Stan is the archetype that pops into your head. The versatile market surfer, patiently waiting for the set, spotting the main wave amongst the chop, and then paddling at full steam.
It’s a romantic image because all the technical details are stripped away. He sees the angle and jumps straight to “bet moar”. Stan’s only problem is his name is slang for fanboy thanks to Eminem when it should be the other name with a short “a” sound — Chad. [That’s my em-dash I assure you. Unlike Stan, if I write like a robot, nobody will listen to me.]
But if we suspend our stanning for Stan for a moment, we’d likely find something quite mundane at the source of his brilliance. Process.
I know, I know. Process, groan, I’m dying of boredom, blah blah.
Gimme a chance to help organize YOUR thoughts by explaining how I see process.
Discretionary trading is a grey box. It’s both art and science. It’s not unlike any creative process (when you put the word “creative” in front, “process” bypasses the gag reflex). The goal is to make money by capitalizing on mispriced securities. The first step is monitoring. You need to know what’s abnormal. You’d like to zoom in on areas of the market where either greed or fear are in control because they offer the same opportunity — a counterparty who is motivated by something other than a sense of value.
Science
Building the cockpit
Start with a hunch. How about:
“Names that have made large moves relatively quickly will attract eyeballs as easily as a car fire on the BQE. Those eyeballs are not normally paying attention to the name, but despite their lack of expertise with the name, many of those eyeballs will be unable to resist trying to make a play on the ball. The reason for their buy or sell can be classified as momentum or reversion (the asset has either underreacted or overreacted, respectively). If these are low-information traders, their behavior, regardless of their stated reason, can be mathematically described as random noise. There’s no adverse selection in their flow, because it’s not informed. However, if there are strong correlations in their flow, it will influence the stock instead of canceling out.”
Where does such a hunch even come from? Maybe a dream. I don’t know. Who cares. (I mean this. Who cares. My apathy will make more sense when we get to the Art.)
The task at hand is to turn the hunch into stuff we can measure. Let’s filter the world for names trading far from their moving average.
Well, what does that mean? “Far” depends on how much a name moves around. HYG being 5% from its moving average can be meaningful, but that’s just noise for oil. Ah, maybe we compute the distance in units of standard deviation. Oh, but what standard deviation? We can use realized volatility. But what lookback? Does it matter or does the choice introduce bias when I compare names? That’s not all. We could also use implied volatility. Oof, but which expiry? And wait a minute, Kris, you tried to smuggle a moving average into the conversation without saying how many days or if it’s exponentially weighted.
You get the idea. There’s lots of decisions! The striations are more visible the closer you look. The hunch is a telescope, but you do research with the microscope. Either way, this is the science. Turning narrative into mathematical language. The language creates blueprints from which you build screens and sensors. String enough instruments together and you have a dashboard. If they wrap around enough curved monitors, you get to be hotly irradiated in a cockpit of your own making.
Measurement, scoring, crunching. We all know systematic traders, the black boxes, do this, but so does Stan. Investing with a process contains these elements of science even for discretionary traders.
Betting On What You Meant To Bet On
Science also plays a role in structuring. Once a sensor lights up, you have to build a trade that pays you when the abnormality corrects.
This is best explained by example. Suppose a futures spread looks fat. The back month is too high over the front. You want to bet on it narrowing. If you sell the spread one-for-one, you are short the spread but you also placed an unintended bet on the level of the market when you only had a view on the slope between the contracts.
Why do I have 2 bets when I only wanted 1?
Because you failed to realize that level and slope are themselves correlated.
If you want to isolate the slope, you must ratio the legs. With what ratio? Oh god, more decisions. Yea, bruh, more decisions. I’d recommend beta-weighting the ratio but beta is a function of correlation and volatility ratios. Which lookbacks do I use? More decisions!
Look at this business.
Jane Street makes you prove you’re the annoying kind of autistic while Stan exhudes the savant variety. Ken talks about hiring and running a company. Buffett sounds like an accountant. Stan is romantic because he crushes it without reference to the tedium. The instruments are there, but he doesn’t talk about the science. He comes off like an artist.
Art
The art is in the judgement.
The sensor is made from science, but where to look in the first place is judgement. The pattern-matching mind. The game-beating mind. If X is true, where’s the secondary effect Y? Invoke “science skill” to see if Y lags X.
“The data says weekend variance is only 10% of weekday, but I notice that Trump only tweets aggro when the market is closed. It’s a small sample size, but it feels significant and it makes sense. How much do I weigh this information? Ahh, maybe I invoke science again and see if the oil market seems to have updated its weekend vol assessment faster than equities.”
Science is handling the structured data, but there is so much unstructured data in your head: what you read this morning, what happened the last three times this setup showed up, what the guy from the other shop said at dinner, how the order book feels when you post, or if the name you’re trading feels “hard to buy”.
If we’re being holistic, and we should, there’s even more beyond the conscious mind. A few years ago, a famous founder offered $1,000 on Twitter to whoever had the best answer to “Where do intrusive thoughts come from?”
I won.
The winning response was a link to Cormac McCarthy’s argument in The Kekulé Problem. The pioneering chemist Kekulé said the benzene ring came to him in a doze, as a snake biting its own tail. Ramanujan famously claimed that complex math formulas came to him from “visions of blood”. Besides being metal af, it supports the idea that your brain is doing some heavy consolidation when you’re unconscious. McCarthy and his fellows at SFI suspect the unconscious has been solving problems for a couple million years longer than language has existed; it works in pictures, and it seems to assemble solutions without leaving behind a log. It’s a straight-up mother of unstructured data.
2 Hemispheres
While I haven’t read McGilchrist, I’ve read enough substacks to know the left brain/right brain split between the analytic and intuitive hemispheres is reductionist. But you know the old joke: there are only 2 kinds of people, those who think in binaries and those who don’t.
I’ll risk conviction as a troglodyte and draw you the visual so you can embrace your whole damn brain.
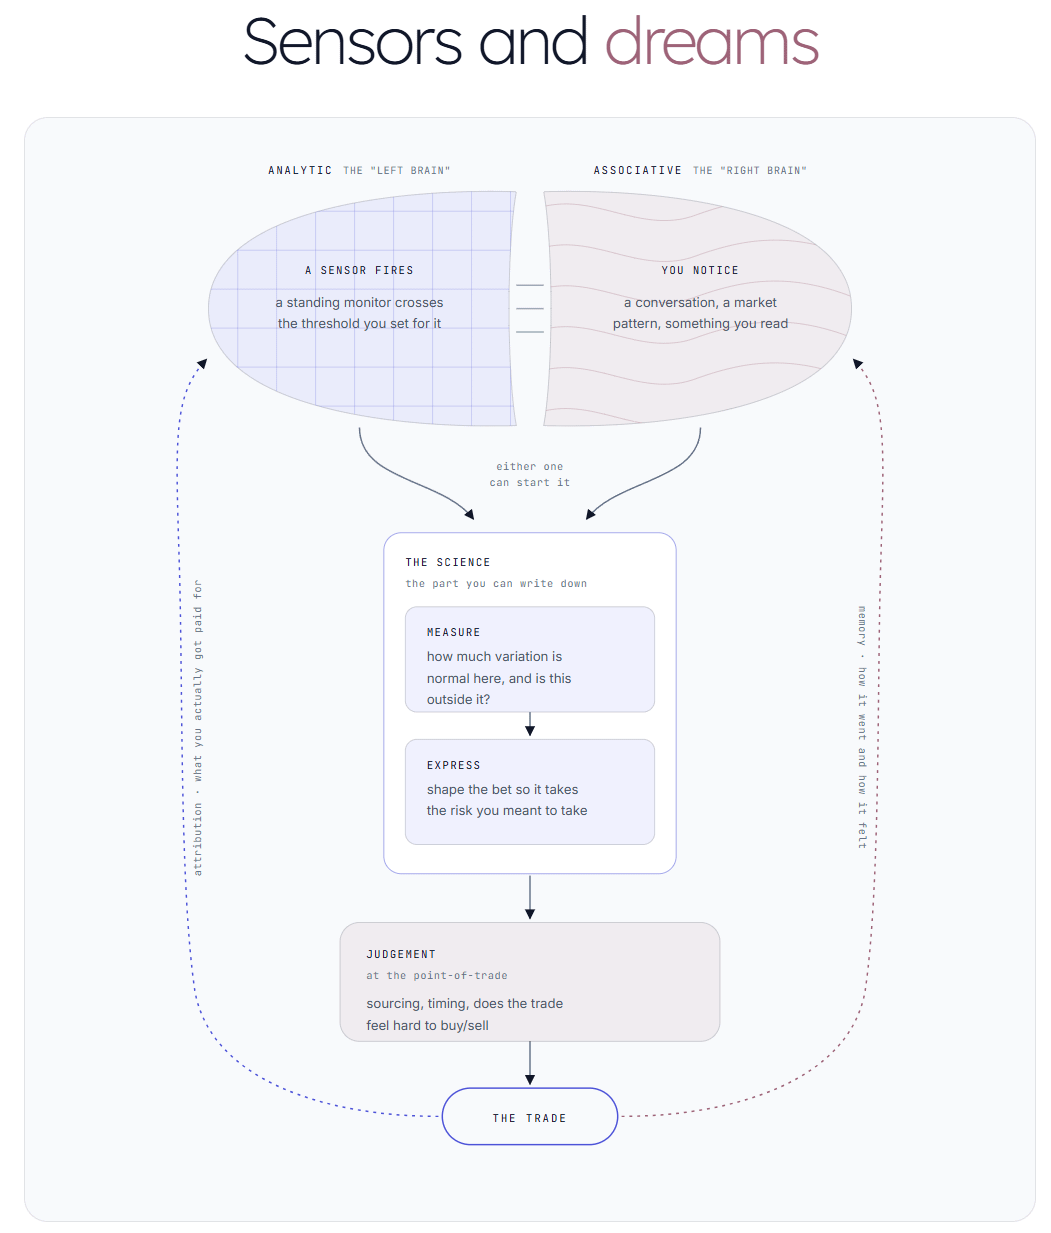
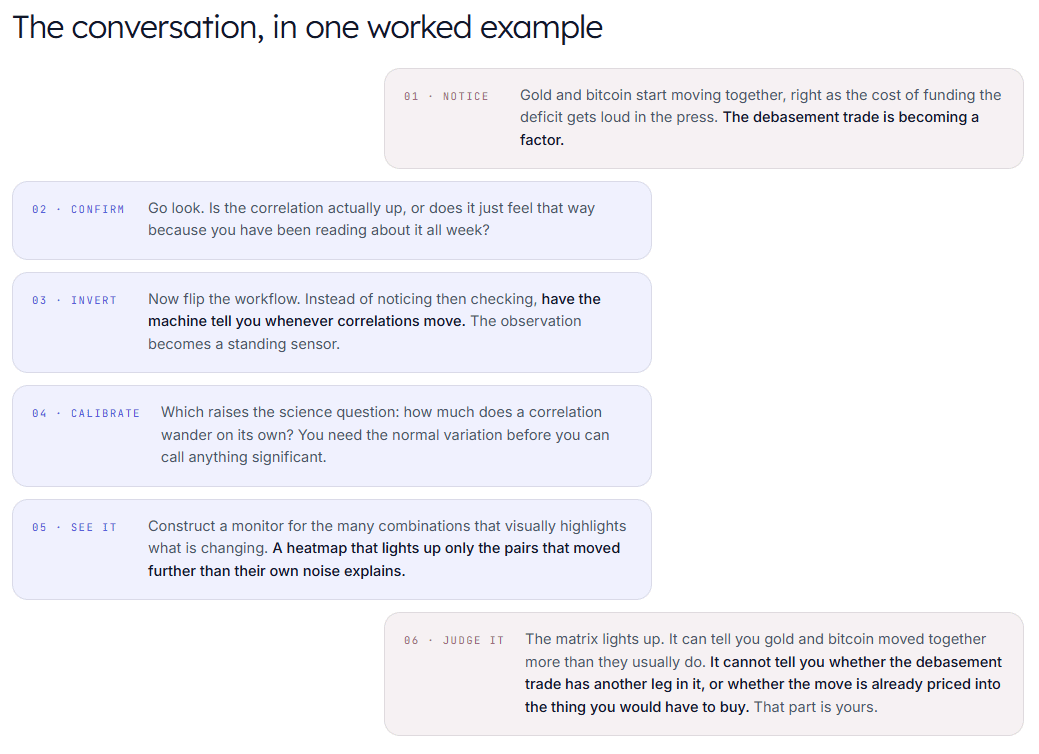
Just to make this a bit more concrete, suppose you notice bitcoin and gold start moving together more as rates are rising. Your grey matter classifier labels the phenomenon “debasement” trade. A quant might incant a “factor” but either way there needs to be a translation of the pattern into “science” if we care to make a process out of market observations, if our responses to these patterns are to transcend gambling.
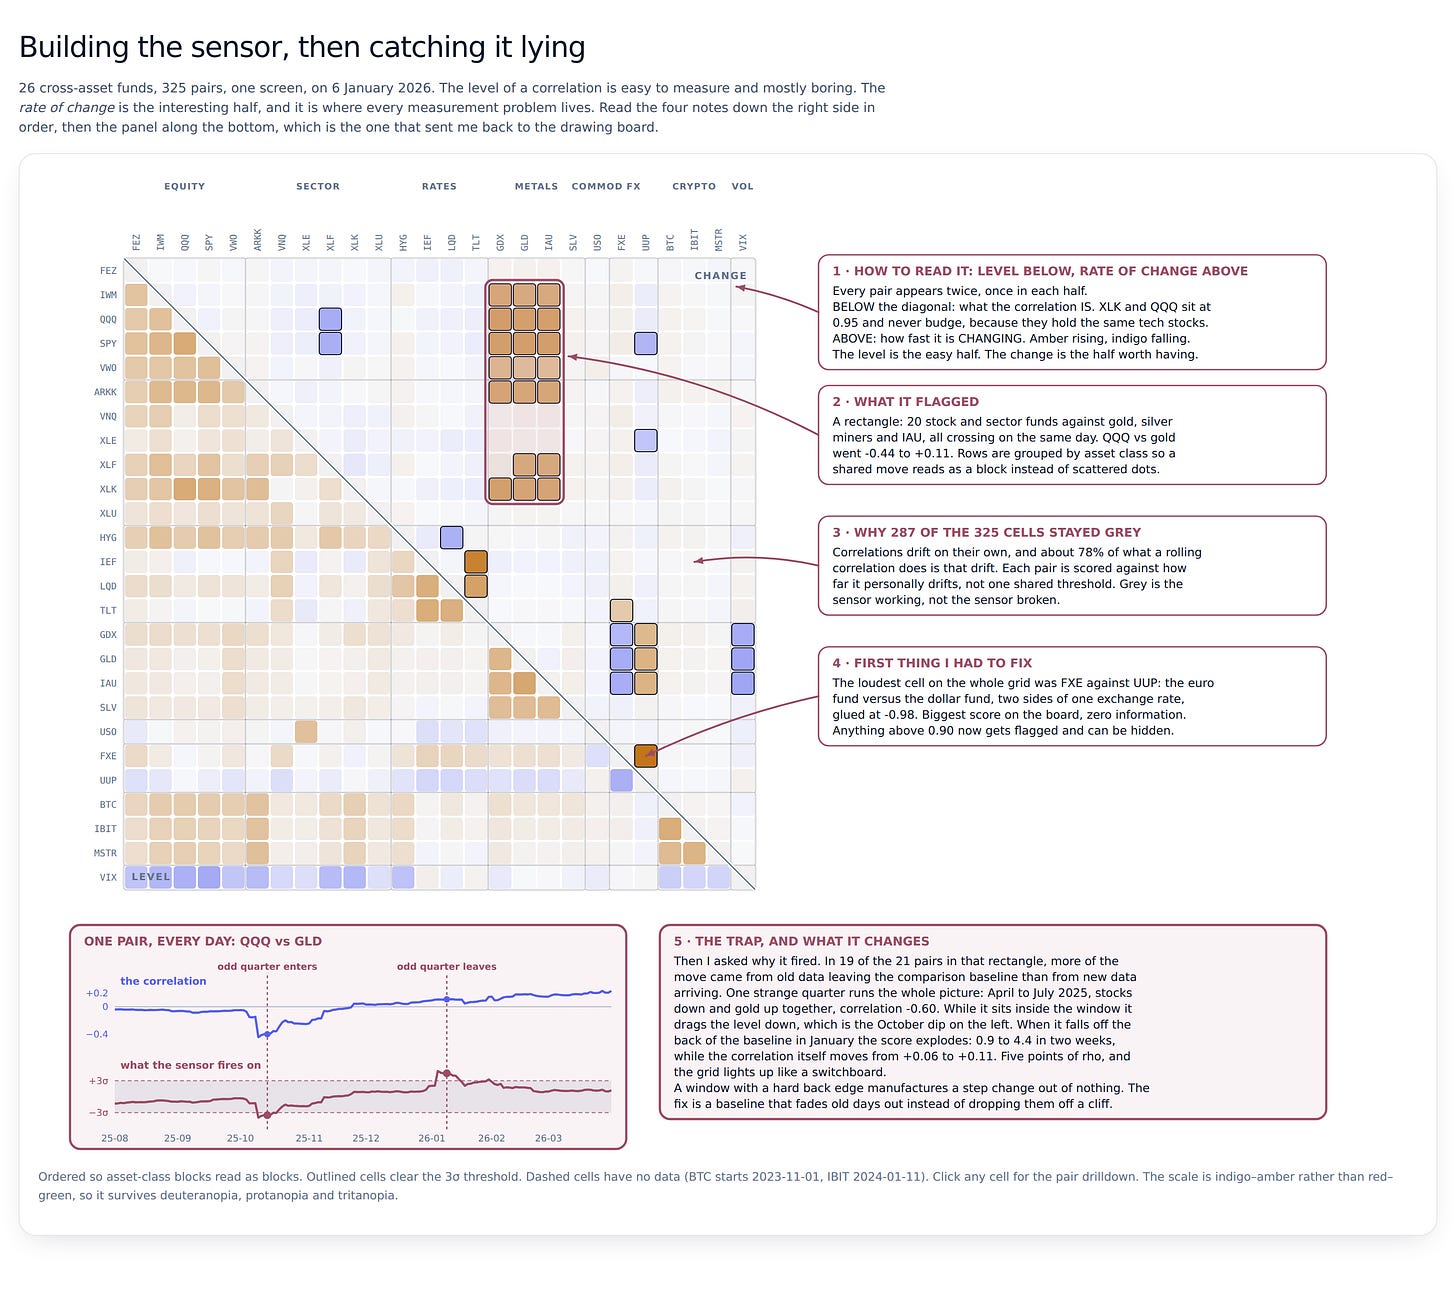
I had Claude whip up a stylized version of step #5’s correlation monitor. It has real data behind it, but it’s a very soft prototype because I made it for this post, not for actual prod. In fact, I retained some of the ways I was unhappy with it as a nitty-gritty example of tedium. (Annotated in the pic)
The monitor shows twenty-six ETFs, so 325 pairs, on one screen. If you read the notes down the right in order, you see the sensor coming together, including the first thing I had to throw out.
The discretionary brain today
The brain diagram above respects the role of unstructured data that lives in your head without minimizing the critical contribution of “science” in operationalizing idea, execution, and feedback.
In this AI era, brains and consciousness are major topics du jour. I increasingly see us as technology centaurs with both a meat and silicon brain mediating structured and unstructured data, which in turn can be private or public.
On the private side, I have Claude connected to:
- my personal knowledge management or PKM (Notion)
- MCP to moontower.ai data
- git repos across work and personal
- email (which means it can access all my writing)
- project management software (Linear)
- Google drive
- Google calendar
And of course, the entire world of public info lives in the model’s training data and ability to go online.
You can be taking a walk with voice mode on spec’ing a prototype that will connect to data with nearly any context you want to provide from your private knowledge, the internet, or what’s in your head that moment.
The future is here for anyone who feels haunted by dozens of ideas a day that they previously couldn’t or wouldn’t act on.
And a discretionary trader is nobody if not someone who starts 50 sentences a day with “I wonder what happens if…”
collar workflow time series
I’ve been writing a lot about option collars.
I have a neat one to show you but a quick refresher:
Suppose you buy a stock, buy a put, sell a call,
The risk-reward on the trade is just cap distance over floor distance. Put 20% away, call 40% away, and you’re taking two-to-one odds. That ratio moves with the vol surface. Vol level sets how far both strikes sit from spot at a fixed delta, and skew decides which side sits further. In the risk-reward of option collars, I map the surface to this concept of risk:reward.
We have a tool for screening equities and ETFs for attractive risk:reward measures in the option market. The screener is handy because it lets you filter on dozens of metrics (there are some canned screens as well that follow certain themes).
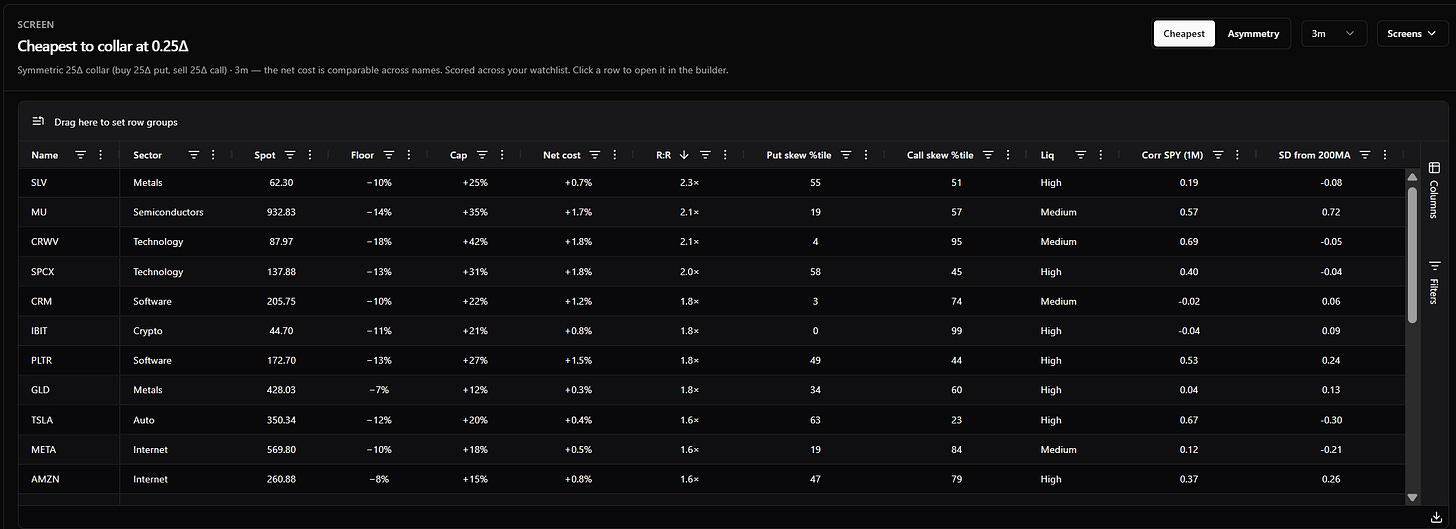
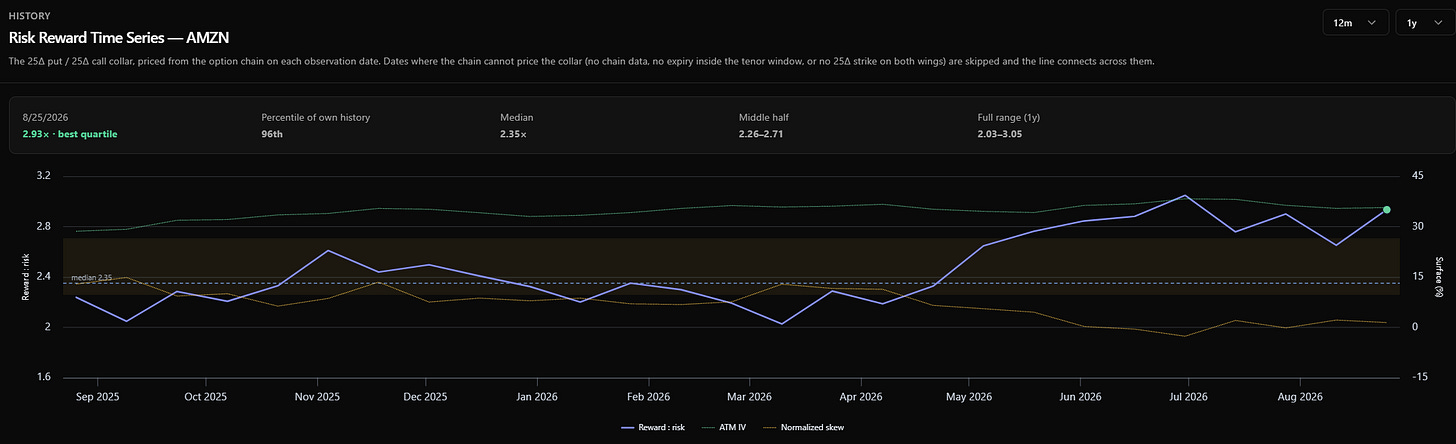
We just added a time series view to the collars workflow.
The screen tells you what’s cheap across the watchlist right now but the time series lets you see the name’s own history.
Anyway, check out AMZN’s 1-year collar.
Reward-risk: 2.93× (near the high for the year) against a 2.35× median and a full-year range of 2.03 to 3.05.
What’s driving the pricing: Skew flattened while ATM vol held up.
You can check out the app at moontower.ai.
The recent workflows for income, defense, and collars have shot up the chart on what our clients are using. Whether you are managing money for yourself or clients, you should give us a look. There’s both art and science to how we help speed up informed decisions :-)